雷哥考研 >题库 > 2020年管理类联考英语二9月公益模考测试卷
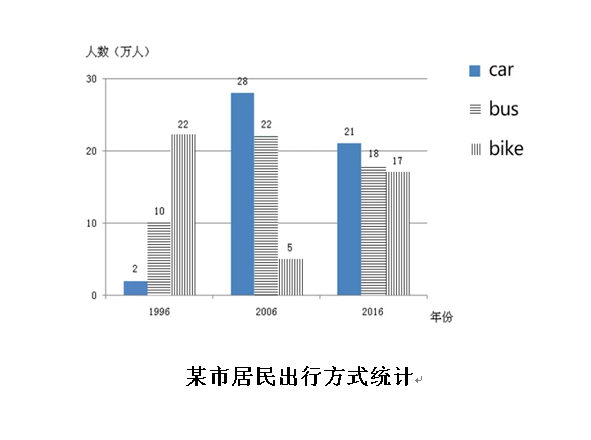
Directions: Write an essay based on the following graph. In your essay, should
1) interpret the chart and
2) give your comments.
You should write at least 150 words on the ANSWER SHEET. (15points)


- 雷哥网解析
- 网友解析
The bar chart above vividly depicts the dramatic changes citizens’ ways of traveling in one city from 1996 to 2016. In 1996, it seemed preferable for people to take a bike and the number was approximately 22,000. However, it plunged to 5,000 in 2006, while the quantities of car-taking and bus-taking topped at 28,000 and 22,000 respectively. In 2016, bike-taking witnesses a sharp return, reaching 17,000.
What can account for the changes of numbers in bike-taking? It is thought-provoking. To begin with, people in the past lived under poor circumstances with a relatively low level of earnings. Quite a proportion of people could not afford cars, so they turned to bikes. Moreover, with the advance of society, a rising number of people are rich enough to purchase cars. However, in recent years, to promote environmentally-friendly transport and ease increasingly grid-locked city streets, the authorities appeal to the public to walk, cycle or take public transportation when they go out. As a result, some people “abandon car for bike”.
As far as I can see, with the improvement of people’s awareness of environmental protection as well as the release of strict rules and regulations, more citizens will prefer cycling.
题目讨论 (0条评论)

提交


 预约成功!
预约成功!


